


Executive Letter
If you followed only the headlines during the first half of 2026, you probably would not have expected markets to finish near all time highs.
Investors navigated conflict in the Middle East, rising oil prices, renewed inflation concerns, uncertainty surrounding interest rates, and continued advances in artificial intelligence. It was another reminder that markets rarely move in a straight line and uncertainty is simply part of the investing experience.
Yet despite these challenges, markets remained remarkably resilient. The S&P 500 reached 24 new all time highs during the first half of the year, corporate earnings continued to grow at a double digit pace, and market leadership expanded beyond a handful of large technology companies. International equities, emerging markets, and commodities all contributed positively to diversified portfolios.
The first six months of 2026 reinforced an important lesson. Markets often recover before uncertainty disappears. While headlines will continue to evolve, history suggests that patient investors who remain focused on well constructed portfolios are often rewarded over time.
Looking ahead, we expect the second half of the year to bring another round of headlines. The upcoming midterm elections, Federal Reserve policy, geopolitical developments, and continued innovation in artificial intelligence will all compete for investors’ attention. Rather than trying to predict every market moving event, our goal is to provide perspective and help clients make informed investment decisions.
Key Market and Economic Drivers in the First Half of 2026[1]
- The S&P 500, Nasdaq, and Dow Jones Industrial Average have returned 9.6%, 12.8%, and 8.9% year-to-date through the end of June, respectively. The second quarter was historically strong with the S&P 500 returning 14.9%, the Nasdaq 21.4%, and the Dow 12.9%.
- The Bloomberg U.S. Aggregate Bond Index has risen 0.6% year-to-date. The 10-year Treasury yield ended the second quarter at 4.47%, rising from 4.17% at the start of the year.
- Developed market international stocks (MSCI EAFE) have gained 7.7% and emerging market stocks (MSCI EM) have returned 22.7% year-to-date, both in U.S. dollar terms.
- The Bloomberg Commodities Index has risen 12.3% year-to-date. This was due to a strong first quarter which experienced a gain of 23.3%, versus a decline of 8.9% in the second quarter.
- Brent crude peaked at just under $120 per barrel in May before closing the quarter at $73 per barrel.
- Gold prices fell to $4,007 per ounce while Bitcoin declined to a recent low of $58,633.
- The Headline Consumer Price Index (CPI), one of the government’s primary measures of inflation that tracks changes in the prices consumers pay for goods and services, increased 4.2% year over year in May, driven largely by higher energy prices. Core CPI, which excludes the more volatile food and energy categories, rose a more modest 2.9%.
- The Federal Reserve kept rates unchanged at 3.50% to 3.75% through the first half of the year. Kevin Warsh was sworn in as Fed Chair in May.
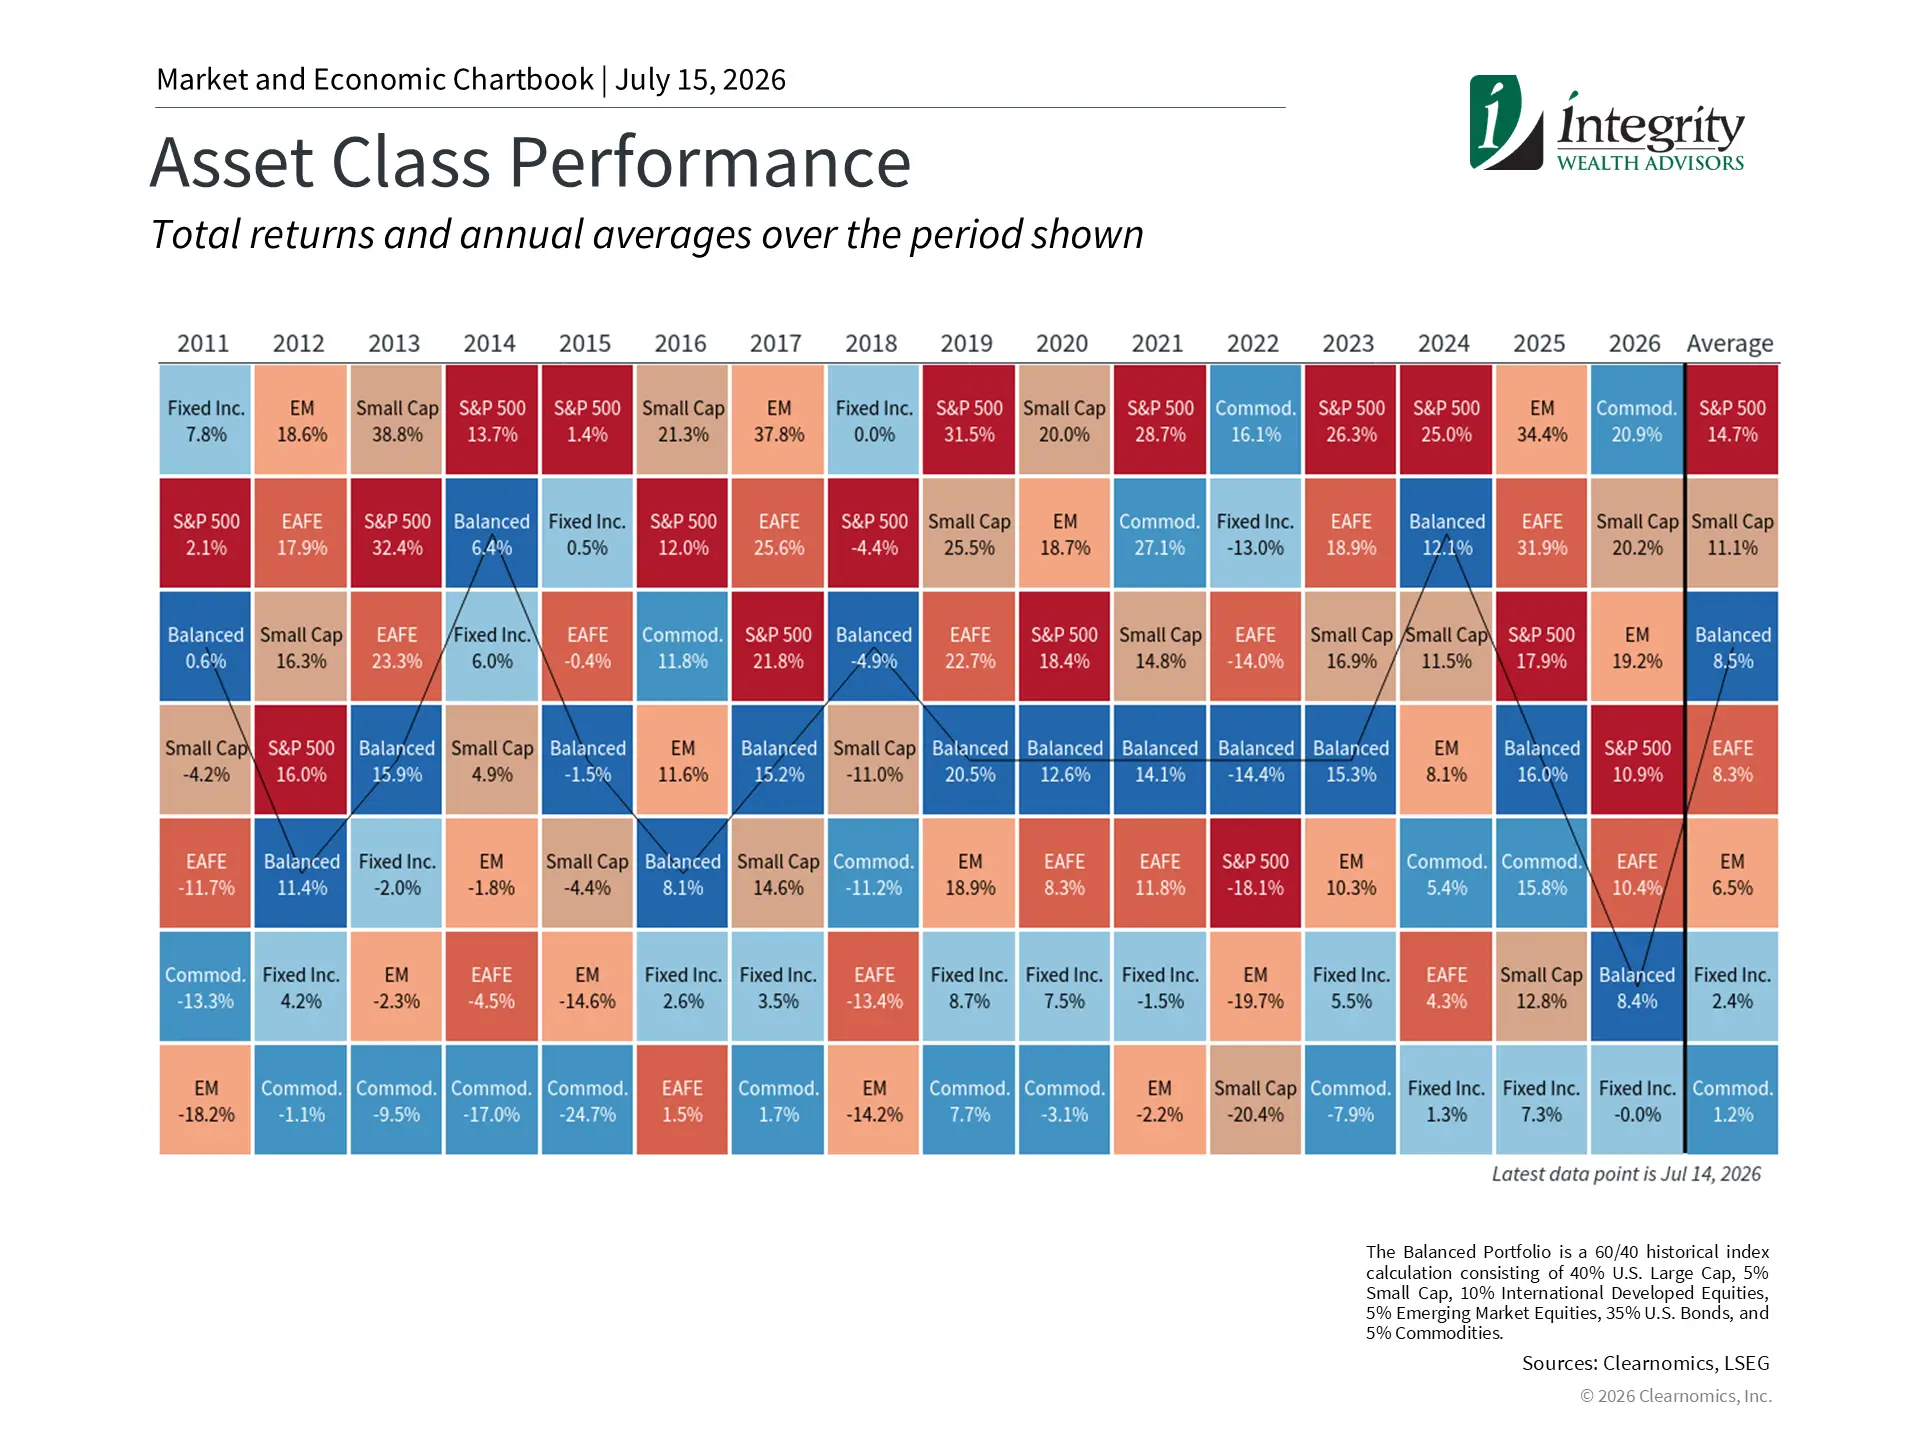
Markets Climbed While Headlines Dominated
One of the most encouraging developments during the first half of 2026 was not simply that markets performed well, but how broad the participation became.
The S&P 500 gained 10.8% through June 6th, while developed international stocks returned 11.4%, emerging markets gained 24.1%, and commodities advanced 16.7%. Rather than relying on a handful of companies to drive returns, leadership expanded across multiple regions and asset classes.
Why does that matter?
Historically, healthier bull markets are supported by broader participation. When more areas of the market contribute to returns, diversified portfolios tend to benefit and investors become less dependent on any single sector or investment theme.
Corporate earnings continued to provide an important foundation for market performance. S&P 500 earnings grew more than 20% over the past year, supported by resilient consumer spending, continued business investment, and enthusiasm surrounding artificial intelligence.
Strong returns have also pushed U.S. stock valuations above historical averages. While higher valuations may suggest more moderate future returns, they are only one input when evaluating portfolios. Diversification and thoughtful portfolio construction remain just as important as identifying investment opportunities.
The business cycle has entered its seventh year
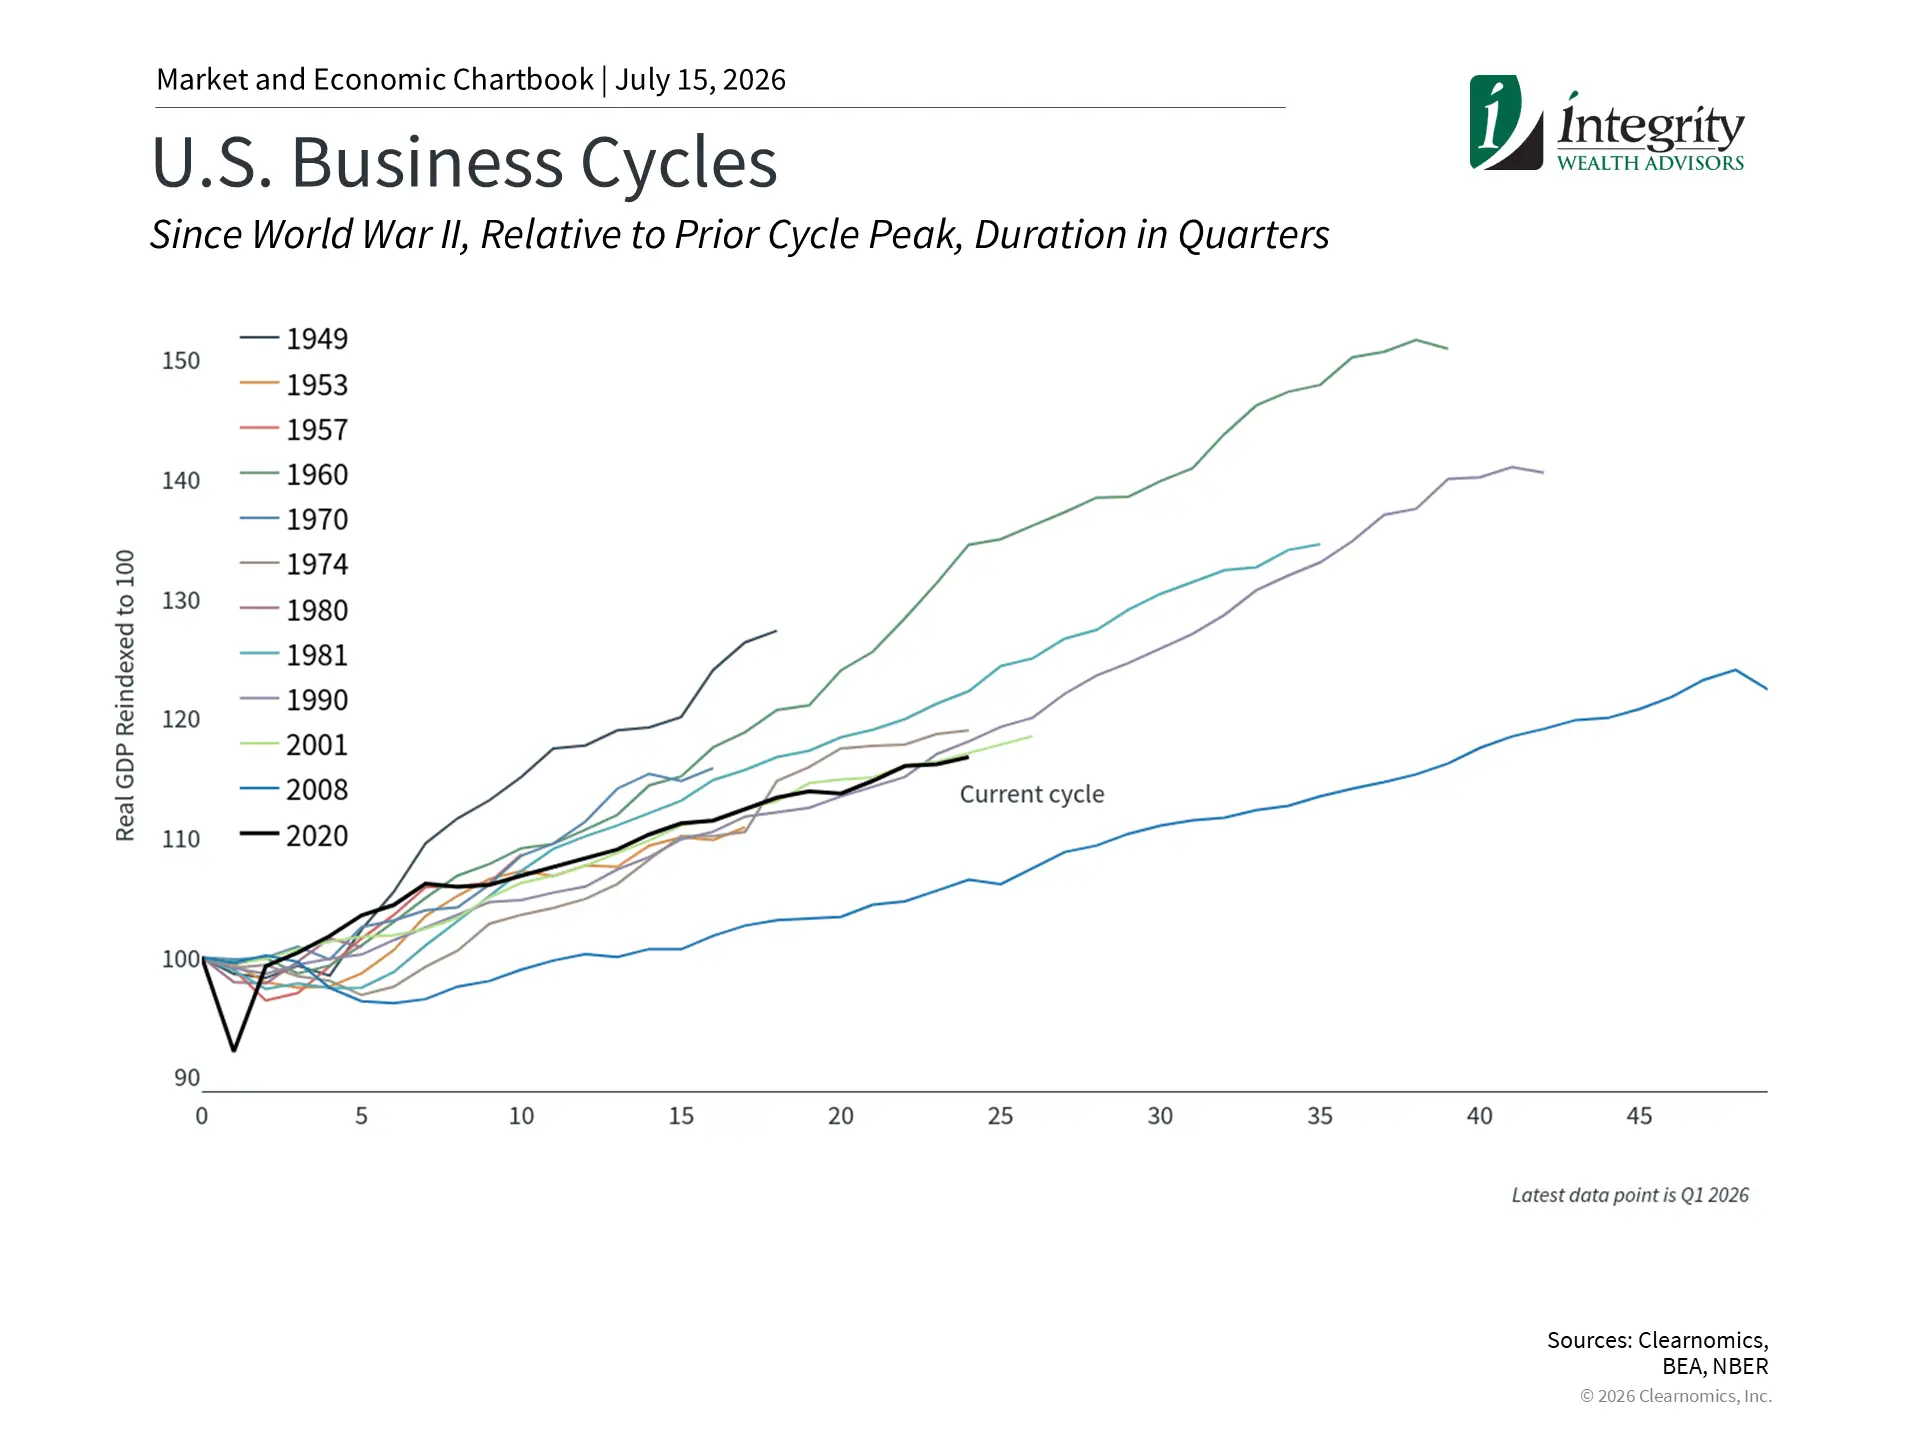
The current economic expansion began in April 2020 following the pandemic recession and has now entered its seventh year.
That may surprise many investors.
Over the past several years, markets have navigated inflation, aggressive Federal Reserve rate hikes, banking concerns, trade uncertainty, and geopolitical conflict. Yet despite repeated predictions of recession, the U.S. economy has continued to grow.
The chart above places today’s expansion into historical context. Several of the longest business cycles have lasted a decade or longer, reminding us that economic expansions do not end simply because they become older.
Today’s economy continues sending mixed signals.
The Consumer Price Index (CPI) continues to remain above the Federal Reserve’s long term target. However, the labor market remains healthy, business investment has improved, and consumer spending has continued despite higher borrowing costs.
While risks remain, today’s economic backdrop continues to support corporate earnings and long term market growth.
Geopolitical Events Create Uncertainty, Not a New Investment Strategy
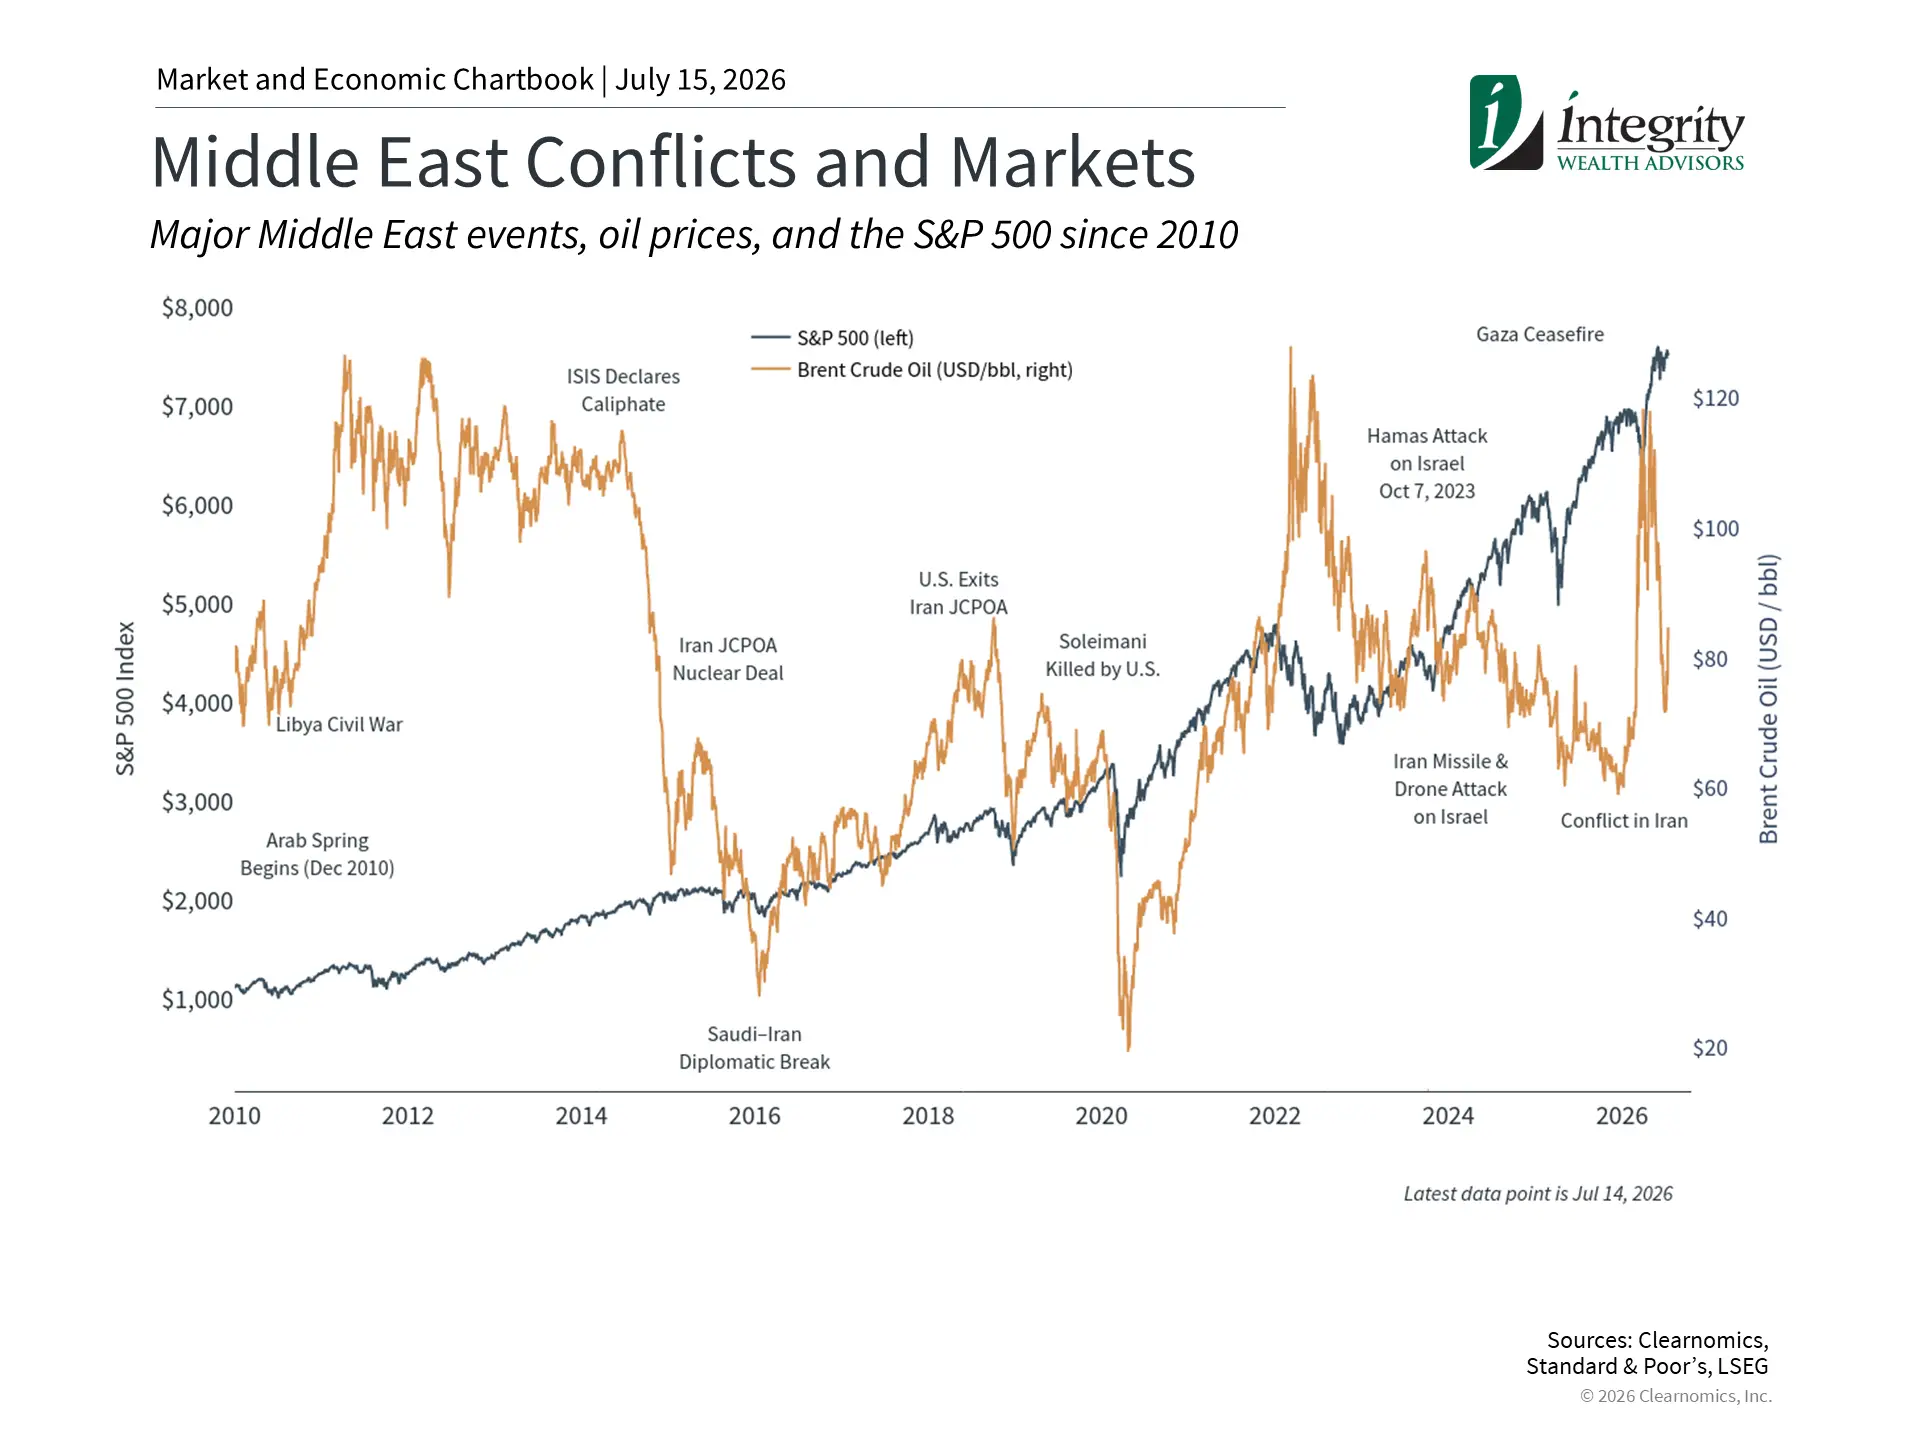
The conflict in the Middle East reminded investors how quickly geopolitical events can influence financial markets.
Concerns surrounding energy supplies briefly pushed oil prices sharply higher, contributing to increased inflation and market volatility. As conditions stabilized, oil prices retraced much of those gains and inflationary pressures began easing.
The chart above provides valuable historical perspective. Although every geopolitical event is unique, markets have repeatedly recovered as investors shifted their focus back toward economic growth, corporate earnings, and business fundamentals.
For investors, the lesson is clear. Headlines often create short term uncertainty, but they have rarely changed the long term direction of diversified portfolios.
Volatility Is Normal. How You Respond Matters.
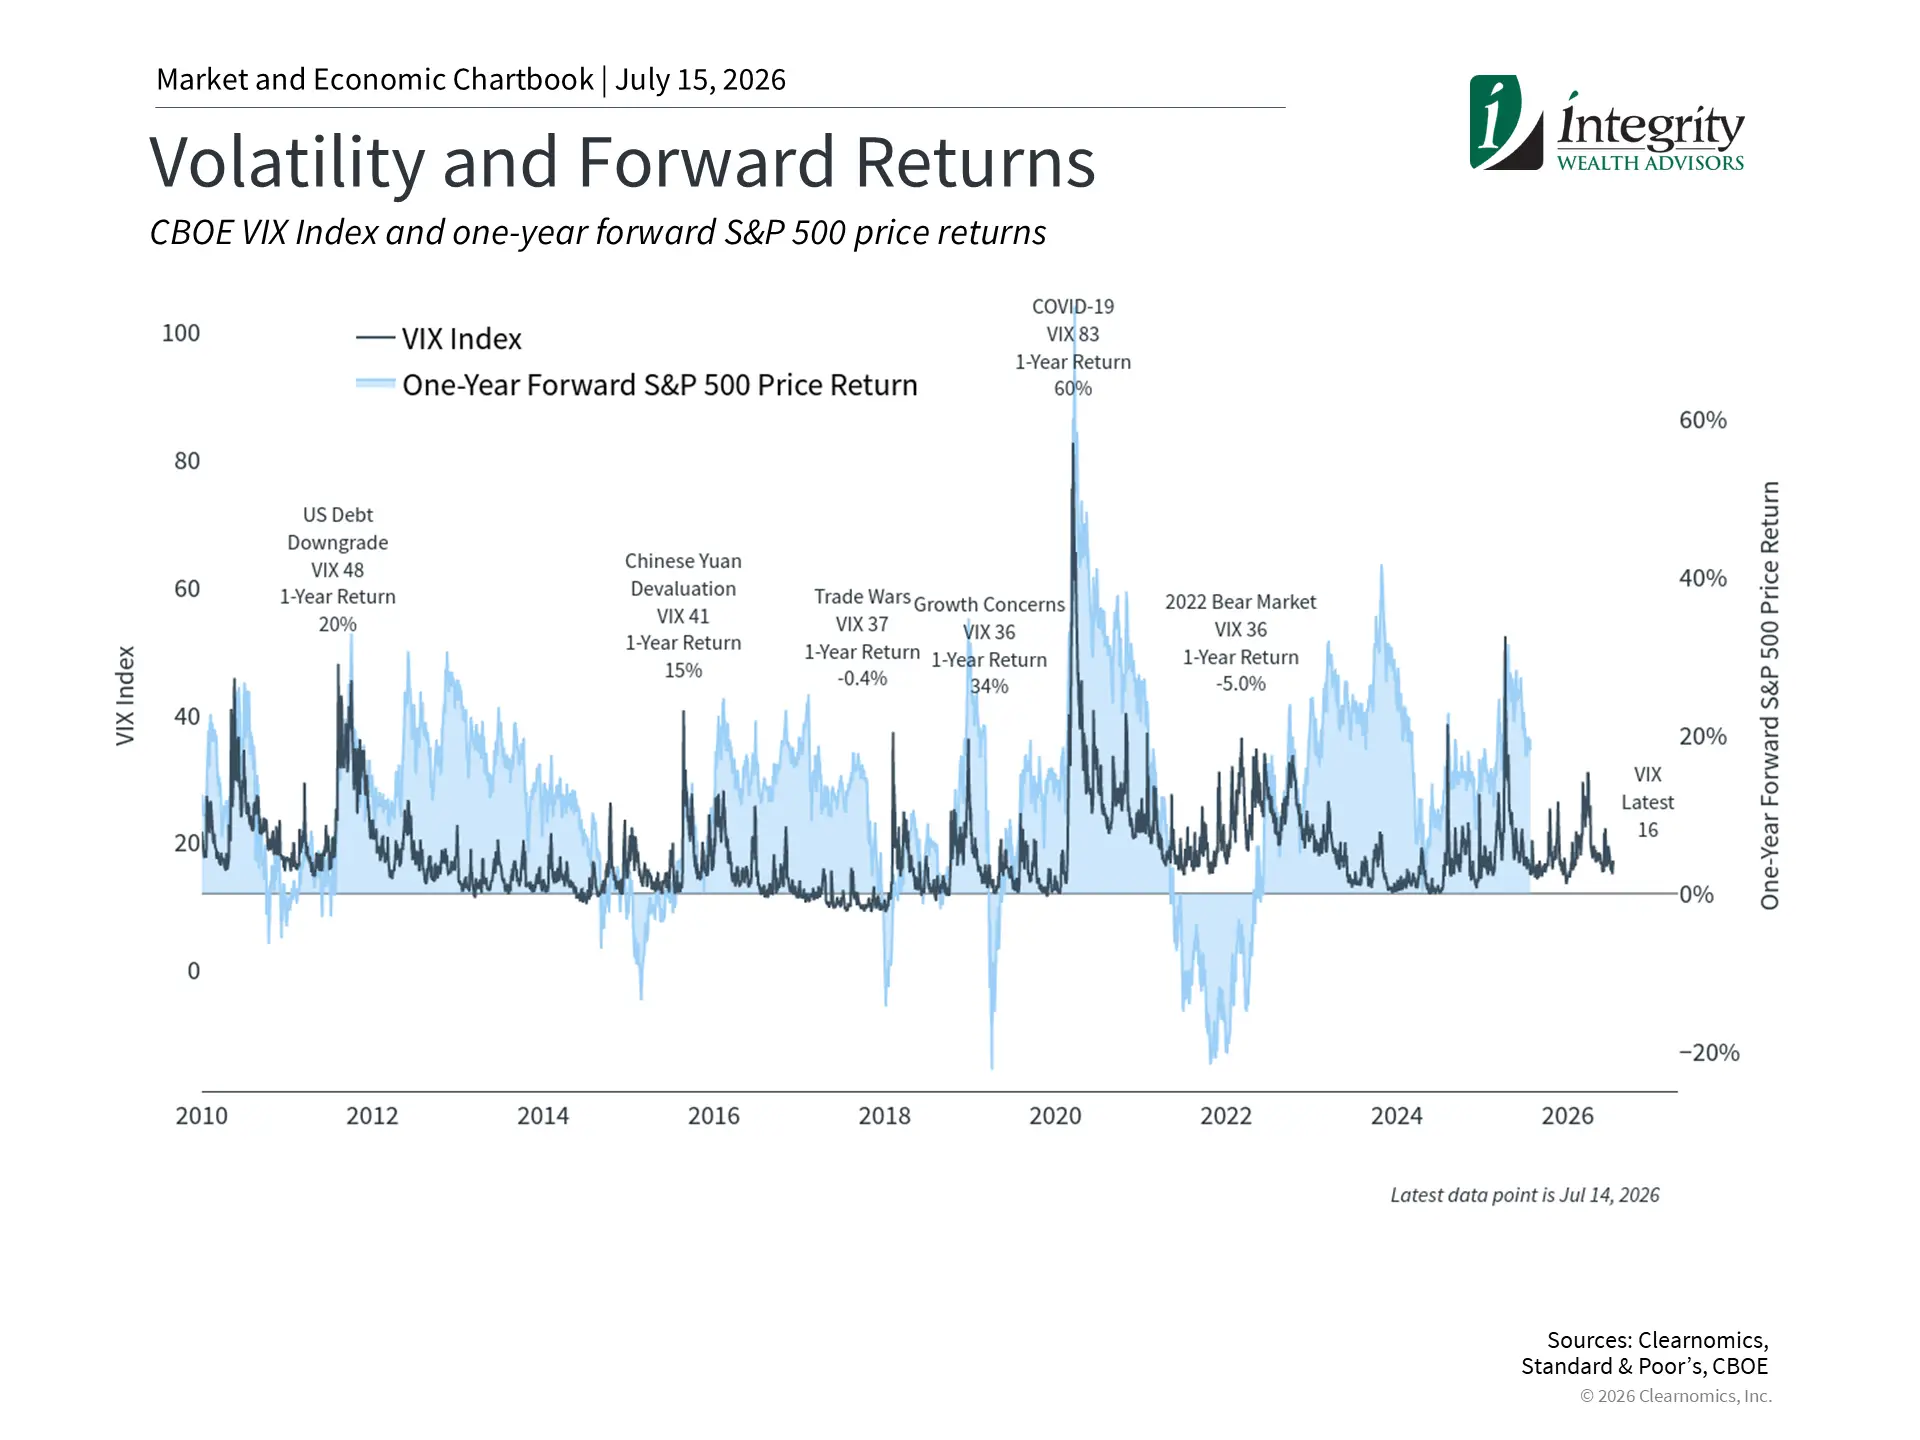
Market volatility remained a familiar theme throughout the first half of the year.
One way investors measure uncertainty is through the CBOE Volatility Index (VIX), often referred to as Wall Street’s “fear gauge.” Today, the VIX sits at 16, below its long term average of 18.4, suggesting today’s market volatility remains well within historical norms despite the constant headlines.
The S&P 500 also experienced a 9% pullback before recovering to reach 24 new all time highs through June.
The chart above highlights an important relationship between market volatility and future returns. While periods of uncertainty often feel uncomfortable in the moment, they have historically been followed by strong market recoveries. During the 2011 U.S. debt downgrade, for example, the VIX surged to 48, yet the S&P 500 gained approximately 20% over the following year. Similarly, during the onset of the COVID 19 pandemic, the VIX reached a record 83, and the market went on to return nearly 60% over the next twelve months. History reminds us that periods of elevated fear have often created opportunities for disciplined investors who maintain perspective rather than react to short term uncertainty.
Keeping Perspective During Election Season
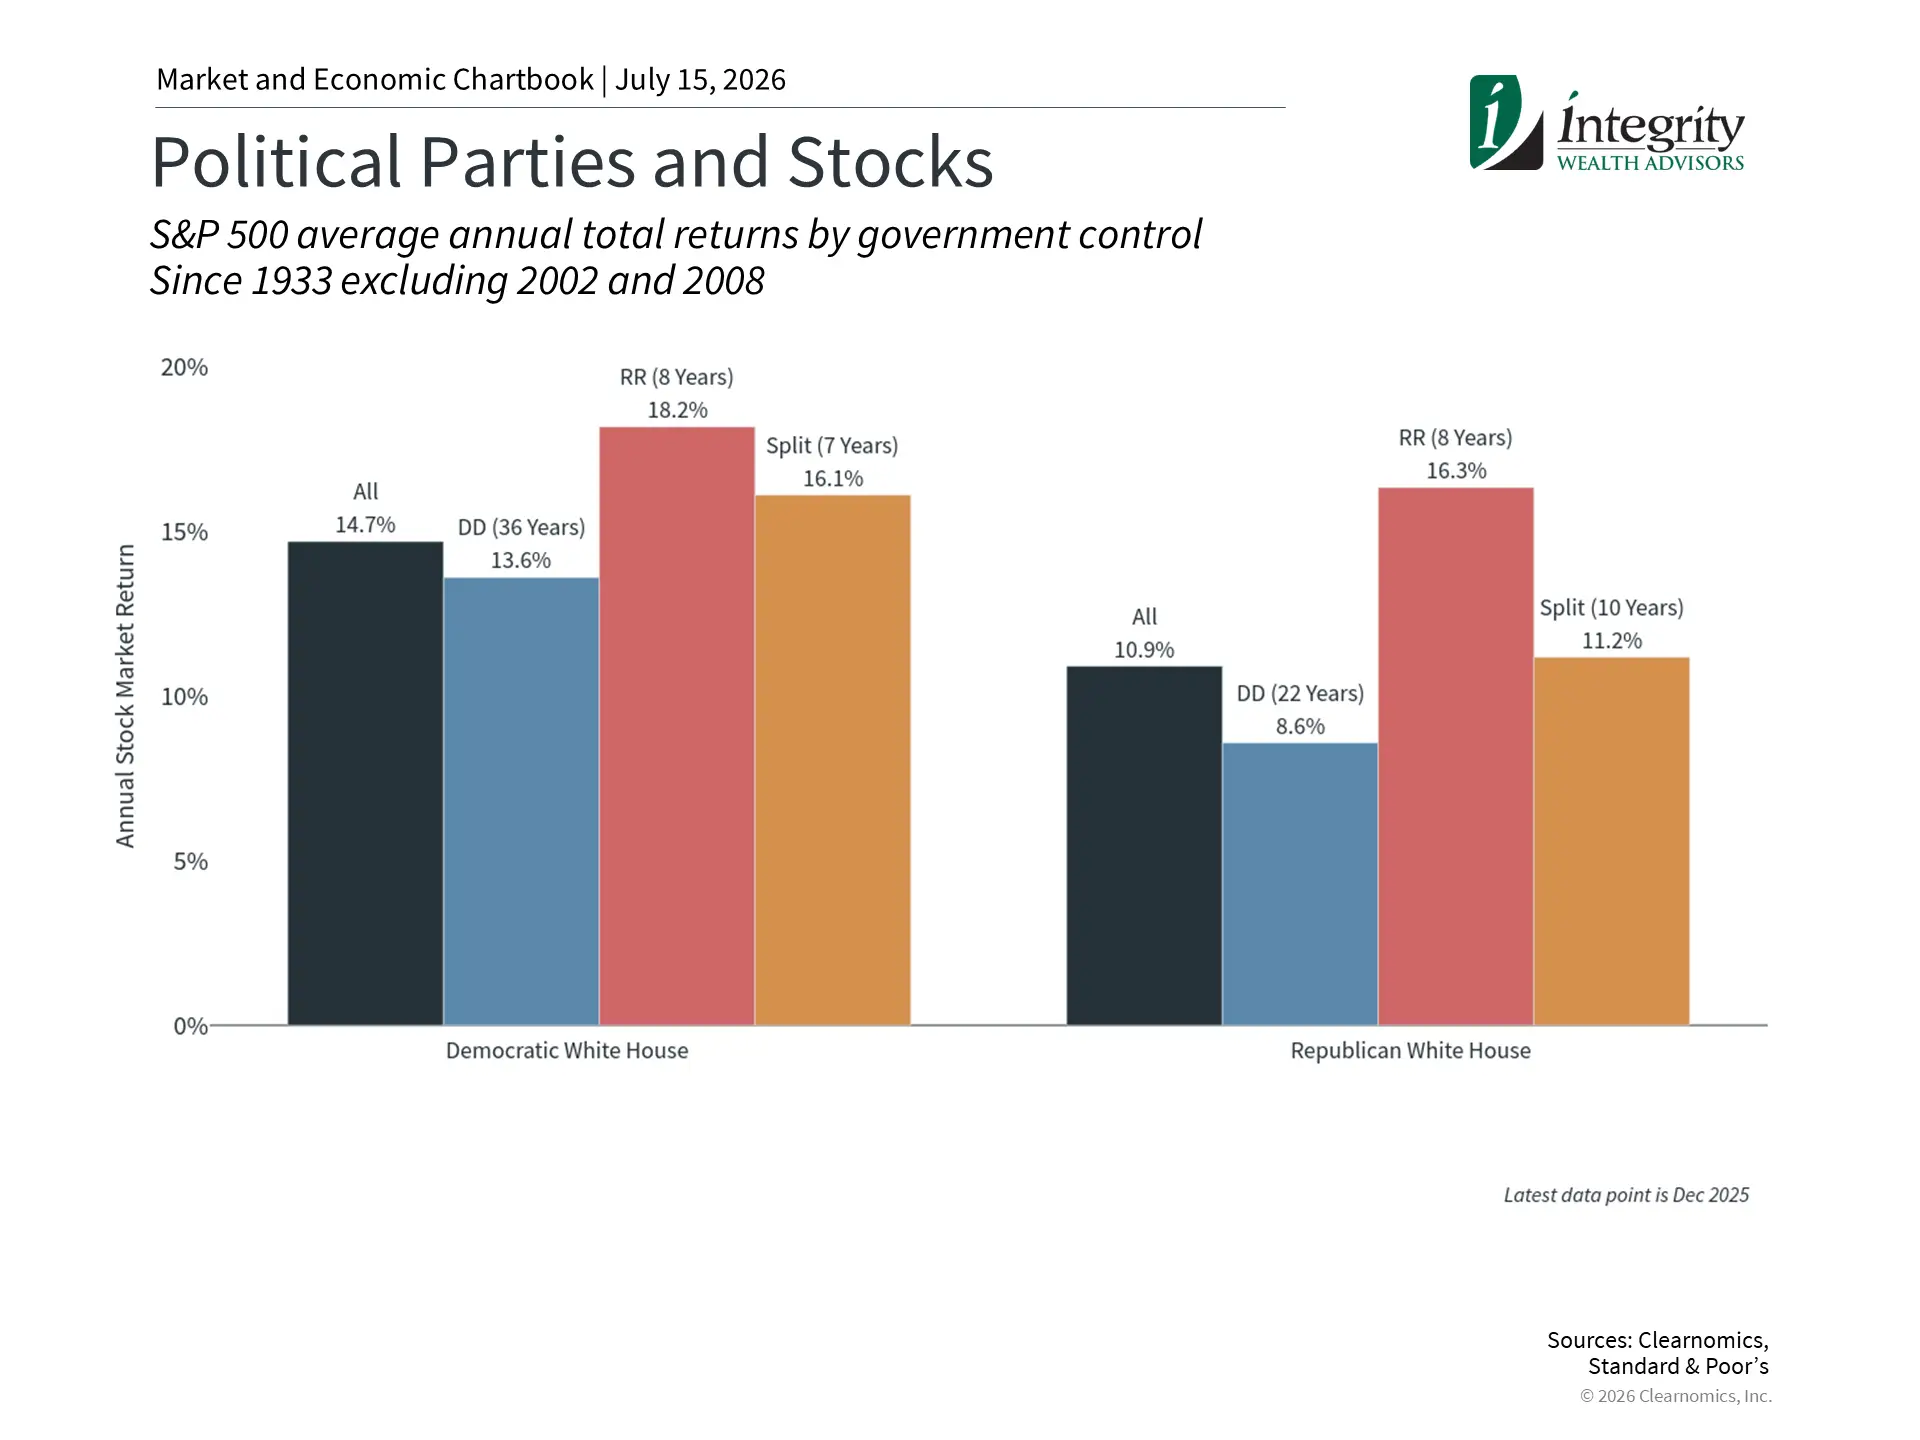
With the 2026 midterm elections approaching, many investors naturally begin asking how political outcomes may affect their portfolios. Election years often bring increased uncertainty as markets react to campaign promises, policy proposals, and shifting expectations around taxes, regulation, and government spending.
The chart above provides valuable historical context. Since 1933, the S&P 500 has generated positive average annual returns under both Democratic and Republican administrations, regardless of which party controlled Congress. Under Democratic administrations, average annual returns ranged from 13.6% when Democrats controlled Congress to 18.2% when Republicans controlled Congress, with 14.7% across all years. Under Republican administrations, average annual returns ranged from 8.6% under Democratic control of Congress to 16.3% under Republican control, with 10.9% across all years.
While the numbers vary across different political environments, one conclusion is consistent. Markets have continued to create long-term wealth regardless of which party occupies the White House or controls Congress. That is because corporate earnings, innovation, economic growth, productivity, and interest rates have historically played a much larger role in driving investment returns than election outcomes alone.
As political headlines increase throughout the second half of the year, investors should remember that elections can influence short term sentiment, but they have rarely changed the long-term direction of the markets. Maintaining perspective during election years has historically proven more valuable than attempting to reposition portfolios based on political expectations.
Perhaps the most important takeaway isn’t which bar is the highest. It’s that every combination of political leadership shown in the chart produced positive average annual returns over time.
The Bottom Line
Every year gives investors a new reason to question the markets.
This year it was inflation, geopolitical conflict, interest rates, artificial intelligence, and an upcoming election. Next year it will likely be something different.
The first half of 2026 reminded us that while headlines change, the principles of successful investing remain remarkably consistent. Markets have historically rewarded investors who maintain perspective, build diversified portfolios, and make thoughtful decisions based on long term objectives rather than short term uncertainty.
As always, we appreciate the trust you place in our team. As we enter the second half of the year, we remain committed to helping our clients understand what is happening in the markets, interpret what it means for their financial lives, and navigate changing conditions with confidence.
Success Creates Complexity. Intention Creates Direction.
[1] All figures are as of June 30, 2026 and are on a price return basis unless otherwise noted
