


Many investors rely on major indices such as the S&P 500, Nasdaq Composite, and Dow Jones Industrial Average to gauge how financial markets are doing. While these benchmarks provide a useful starting point, the stock market encompasses thousands of companies, each responding to economic and market forces in its own way. To better understand these dynamics, stocks are frequently grouped by sector, geography, company size, and investment style. Each of these groupings can serve an important function within long-term portfolios.
Headlines about the S&P 500 setting new records or the Nasdaq being propelled by artificial intelligence can create the impression that all stocks are moving in lockstep. In reality, a great deal is happening below the surface. This is particularly relevant today, as key market drivers such as AI, oil prices, interest rates, and tariffs are influencing all corners of the market, not just large cap stocks. Developing a deeper understanding of these drivers can help investors maintain balance and keep their portfolios oriented toward long-term objectives.
In recent periods, segments including small cap stocks, value stocks, and international equities have outperformed, and their valuations have generally remained more attractive. Appreciating how different sizes and styles have fared can help investors sustain a well-balanced approach. So, what is taking place beneath the headline indices, and what does it mean for investors?
Market conditions affect different sizes and styles in distinct ways
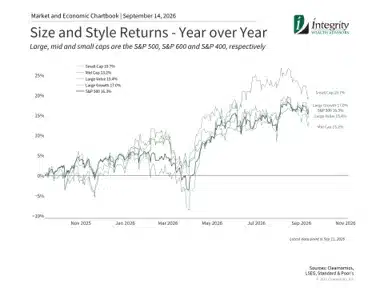
Although the overall market has posted double-digit returns this year, at least two meaningful trends have been unfolding beneath the surface.1 First, value stocks have outperformed over the past year, marking a reversal from the post-2022 period when growth stocks delivered strong results driven by technology and AI investment.2
The distinction between value and growth is significant for investors and has been the focus of extensive academic research over the past 50 years.3 Value is generally defined as companies with appealing valuation ratios, meaning their prices are low relative to fundamentals such as earnings or sales. Growth, by contrast, refers to stocks with higher valuations that reflect anticipated gains in earnings and market share, and often captures trends that investors find compelling. The specific companies that fall into each category can shift over time, as seen with dot-com stocks in the late 1990s and AI stocks today.
Value stocks have outperformed this year for several reasons, including uncertainty surrounding interest rates and the strong performance of the Energy sector on the back of elevated oil prices.4 Interest rates remain near multi-decade highs, a condition that tends to weigh more heavily on growth stocks. This is because their prices reflect future growth expectations, and higher interest rates reduce the present value of those future cash flows.
Second, small cap stocks have outperformed large cap stocks this year, reversing a broad trend that had persisted for well over a decade. Prior to this year, small cap stocks had lagged the S&P 500 since 2020.5
Small caps have been strong this year for many of the same reasons driving the broader market. AI, for example, is often seen as a large cap opportunity, but many smaller industrial and technology companies supply the equipment, components, and services required to build data centers and related infrastructure. As a result, these businesses are experiencing robust revenue and earnings growth that rivals other segments of the market.
One challenge is that small caps tend to be more sensitive to interest rates, given their more limited access to financing compared to larger companies. This has introduced uncertainty across the group as long-term rates remain elevated and the prospect of Federal Reserve rate increases grows. However, history suggests this relationship is not absolute. Two of the strongest periods for small cap relative performance occurred in the late 1970s and the mid-2000s, both of which featured higher interest rates and inflation.6 There are several explanations for this, including the fact that smaller businesses can sometimes pass along price increases more readily, supporting their operating margins.
Valuations play a key role in long-term investment outcomes
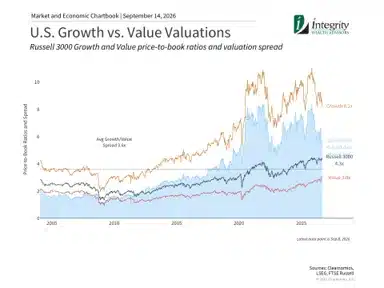
The significance of different stock market styles extends beyond past returns to encompass valuations as well. Over the long run, lower valuations have historically been associated with stronger forward returns, making it worthwhile to consider all parts of the market.
The stock market is often described as moving through “regimes,” or extended periods when certain investment styles tend to lead. These regimes can span months, years, or even decades. Among the most studied examples is the dominance of value stocks for much of the 20th century, which gave way to growth leadership during the dot-com era.
The accompanying chart illustrates the gap between growth and value valuations using the price-to-book ratio. Growth stocks, particularly the largest technology companies, are trading near historically elevated valuations.7 In comparison, value stocks and smaller companies appear more attractively priced. As always, past performance does not guarantee future results, so these valuation differences do not ensure that value or small caps will continue to lead. They do, however, help explain why market leadership has shifted and why investors should consider a range of market segments in their portfolios.
The key takeaway is not to attempt to time these rotations, but to acknowledge that no single trend persists indefinitely. Maintaining an appropriate balance across styles and sizes, rather than pursuing whatever has recently outperformed, has historically served investors well.
International markets offer an additional avenue for diversification
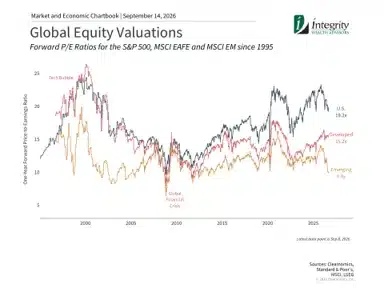
The same logic that applies within the U.S. market extends across geographies. Just as different sizes and styles respond differently to economic conditions, so too do markets around the world. This is why international diversification can be a valuable tool for long-term investors.
Emerging market stocks, for instance, have performed well this year as earnings growth expectations have improved and valuations have grown more attractive.8 The accompanying chart shows that valuations for both emerging market and developed market stocks remain well below those of the U.S. across many measures. Although U.S. stocks outperformed for much of the prior decade, returns since the start of last year demonstrate that this dynamic can shift unexpectedly.
Of course, international investing brings its own set of considerations, including geopolitical, currency, and regulatory risks. These factors are precisely why international stocks behave differently from U.S. stocks over time. That said, many U.S. multinational companies already generate significant revenues abroad, which naturally provides a degree of geographic exposure. When combined thoughtfully with domestic holdings, international allocations can contribute to a more balanced portfolio.
Ultimately, which parts of the market belong in a portfolio depends on each investor’s individual needs, goals, and risk tolerance. The goal is not to forecast whether small caps will maintain their lead or whether value stocks will continue to outperform. Rather, it is to recognize that the stock market is far broader than the small number of companies that tend to dominate the news.
The bottom line? While major indices are a helpful starting point for understanding market performance, not all segments of the market behave alike. Maintaining balance across sizes, styles, and geographies is an important way for investors to build a portfolio that supports their long-term financial goals.
References
1. S&P 500 Index as of September 11, 2026
2. Clearnomics research and the Russell 3000 Value and Growth indexes, as of September 11, 2026
3. Fama and French, 1992, “The Cross-Section of Expected Stock Returns,” https://www.jstor.org/stable/2329112
4. Clearnomics research, LSEG and FTSE Russell, as of September 11, 2026
5. Clearnomics research and the Russell 2000 Index, as of September 11, 2026
6. Banz, 1981, “The Relationship Between Return and Market Value of Common Stock,” https://www.sciencedirect.com/science/article/abs/pii/0304405X81900180
7. Clearnomics research, LSEG and FTSE Russell, as of September 11, 2026
8. Clearnomics research and the MSCI Emerging Markets Index, as of September 11, 2026
Index Descriptions
S&P 500
The Standard & Poor’s 500 Index is a capitalization-weighted index of 500 stocks designed to measure performance of the broad domestic economy through changes in the aggregate market value of 500 stocks representing all major industries.
Russell 3000
The Russell 3000 Index is a stock market index that tracks the performance of the 3,000 largest companies listed on the U.S. stock exchange.
Russell 2000
The Russell 2000 Index is a capitalization-weighted index designed to measure the performance of the small-cap segment of the U.S. equity universe. It includes approximately 2,000 of the smallest securities in the Russell 3000 Index.
MSCI Emerging Markets Index
The MSCI EM (Emerging Markets) Index is a free float-adjusted market capitalization weighted index that is designed to measure the equity market performance of the emerging market countries of the Americas, Europe, the Middle East, Africa and Asia. The MSCI EM Index consists of the following emerging market country indices: Brazil, Chile, Colombia, Mexico, Peru, Czech Republic, Egypt, Greece, Hungary, Poland, Qatar, Russia, South Africa, Turkey, United Arab Emirates, China, India, Indonesia, Korea, Malaysia, Philippines, Taiwan, and Thailand.
MSCI EAFE Index
The MSCI EAFE Index is a free float-adjusted market capitalization index that is designed to measure the equity market performance of developed markets, excluding the US & Canada. The MSCI EAFE Index consists of the following developed country indices: Australia, Austria, Belgium, Denmark, Finland, France, Germany, Hong Kong, Ireland, Israel, Italy, Japan, the Netherlands, New Zealand, Norway, Portugal, Singapore, Spain, Sweden, Switzerland and the UK.
Copyright (c) 2026 Clearnomics, Inc. All rights reserved. The information contained herein has been obtained from sources believed to be reliable, but is not necessarily complete and its accuracy cannot be guaranteed. No representation or warranty, express or implied, is made as to the fairness, accuracy, completeness, or correctness of the information and opinions contained herein. The views and the other information provided are subject to change without notice. All reports posted on or via www.clearnomics.com or any affiliated websites, applications, or services are issued without regard to the specific investment objectives, financial situation, or particular needs of any specific recipient and are not to be construed as a solicitation or an offer to buy or sell any securities or related financial instruments. Past performance is not necessarily a guide to future results. Company fundamentals and earnings may be mentioned occasionally, but should not be construed as a recommendation to buy, sell, or hold the company’s stock. Predictions, forecasts, and estimates for any and all markets should not be construed as recommendations to buy, sell, or hold any security–including mutual funds, futures contracts, and exchange traded funds, or any similar instruments. The text, images, and other materials contained or displayed in this report are proprietary to Clearnomics, Inc. and constitute valuable intellectual property. All unauthorized reproduction or other use of material from Clearnomics, Inc. shall be deemed willful infringement(s) of this copyright and other proprietary and intellectual property rights, including but not limited to, rights of privacy. Clearnomics, Inc. expressly reserves all rights in connection with its intellectual property, including without limitation the right to block the transfer of its products and services and/or to track usage thereof, through electronic tracking technology, and all other lawful means, now known or hereafter devised. Clearnomics, Inc. reserves the right, without further notice, to pursue to the fullest extent allowed by the law any and all criminal and civil remedies for the violation of its rights.
